

Within this section you will find
HighLights
- Rooftop PV plant output is dependent on
- Location
- Roof orientation
- Panel efficiency
- Ambient temperature
- Two panels of identical rated capacity but different efficiency will produce the same amount of power, but occupy different amounts of space
- Heat affects the panel efficiency, and peak summer months can give lower output than some winter months
- We can mitigate some of the effects of temperature by designing the plant to maximise air cooling
- In India Rooftop Solar PV produces about 4 KWh/day for every 1 KWp of panel capacity
Putting up Rooftop Solar for your Industries / Commercial Buidings?
Send a note to ramya@solarmango.com
Factors affecting rooftop solar plant output
The power output of a rooftop solar system is dependent on several factors such as
- Location
- Orientation of the roof
- Panel efficiency
- Ambient temperature
Location
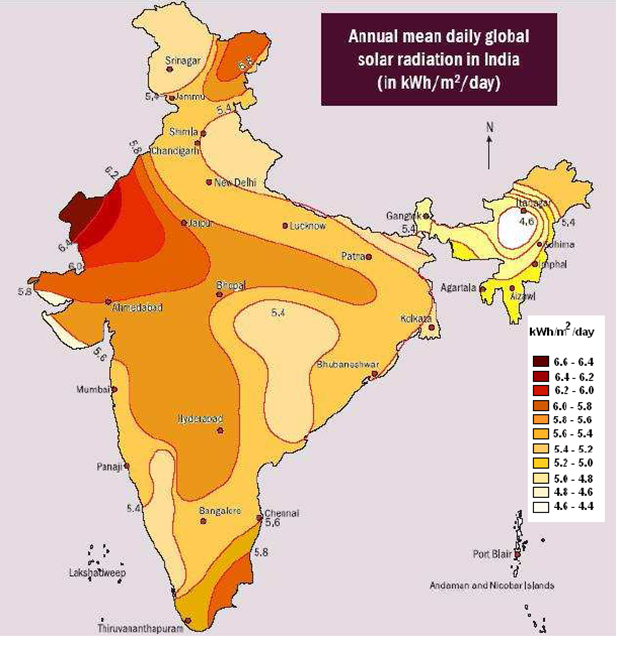
Your location determines the amount of solar insolation (sunlight falling on the panel per day).
- We generally receive 4-7 KWh of solar insolation per square metre in India
- The approximate solar insolation at your location can be ascertained by entering the latitude and longitude of your location at the NASA website
- To be absolutely certain of solar insolation at a particular site we would have to place sensors on-site that measure the actual insolation received over a period of time. This is both an expensive and time consuming process
This map shows the solar insolation across different regions in India.
Orientation
In the northern hemisphere a south-facing roof is ideal as the sun is always to the south if you are in the temperate zone and predominantly in the south for many parts of the tropical zone.
If a south-facing roof is not available an east-west facing roof could also be considered (as it will cover the sun’s movement across the sky from east to west during the day). As the output of the solar plant reduces in proportion to a horizontal angle greater than 15% from due south, the output for the particular site should be calculated and assessed to understand the impact on power generation from an east-west facing roof.
Solar PV plants are not restricted to flat roofs – they can be mounted on sloped roofs as well, with a correction in the angle of mounting for the slope of the roof.
| Investing in a MW Scale Solar Power Plant…But New to the Solar Sector? Take Help from Experts @ Solar Mango Talk to Ramya @ 9489339903, ramya@solarmango.com Click here to know more |
Panel Efficiency
Efficiency of the panel is calculated as ratio of capacity of the panel (KWp) with respect to the size (area) of the panel (m2), expressed as a percentage. This table illustrates the calculation for different panel capacities having the same size:
| Panel Capacity (Wp) | Panel size (m2) | Panel efficiency [Wp/(1,000*m2)] |
| 200 | 1.61 | 12.42% |
| 225 | 1.61 | 13.98% |
| 250 | 1.61 | 15.53% |
Note: Efficiency of a solar panel is calculated with respect to the size of the panel, and therefore the efficiency percentage is relevant only to the area occupied by the panel. If two panels have the same capacity rating (Wp), their power output is the same even if their efficiencies are different.
To illustrate: A 1KW rooftop solar plant will produce the same power output whether it uses lower or higher efficiency panels. The area occupied by the plant with lower efficiency panels will be greater than the area occupied by the plant with higher efficiency panels, but the power output is the same.
The efficiency of the panels matters where the rooftop space is limited. As the lower efficiency panels occupy a greater area than higher efficiency panels, we will be able to install fewer panels in the same size roof. Fewer panels mean lower plant capacity, and therefore lower power output from the plant.
This is illustrated in this table:
| Panel efficiency | Area required for 1 KW | Roof area available | Plant capacity that can be installed(Roof area/Area required) |
| Lower | 120 SF | 1,000 SF | 8.33 KW |
| Higher | 100 SF | 1,000 SF | 10.00 KW |
Ambient Temperature
Solar panel temperature is an often ignored but critical parameter in a hot country like India. Though it might seem counter-intuitive, solar PV panels generate less power in very hot summers as the heat reduces their efficiency (the voltage reduces). In Chennai, the month of January delivers better output than May
Temperature Coefficient
The rated capacity, or power, of a solar panel (e.g. 250 Wp) is measured at 25°C. The effect of temperature on the solar panel’s power is measured by its thermal coefficient, expressed as %/K or %/°C. It denotes the % change in power for 1 degree change in Kelvin or Celsius (both are the same on a unit level) above 25°C. A negative (-) sign indicates the direction of the change.
A temperature coefficient of -0.447 indicates that every 1°C increase in temperature over 25°C will cause a 0.447% decrease in power. Equally, every 1°C decrease in temperature over 25°C will cause a 0.447% increase in power. This is illustrated in this table:
| Rated panel capacity (Wp) | Temperate (° C) |
Temperature Coefficient | Effective panel capacity (Wp) | Change in Wp |
| 250 | 20 | -0.45% | 255.59 | 102.24% |
| 250 | 25 | -0.45% | 250.00 | 100.00% |
| 250 | 35 | -0.45% | 238.83 | 95.53% |
| 250 | 45 | -0.45% | 227.65 | 91.06% |
Approximation of PV plant output
As we have seen, estimating the power output from your rooftop solar plant can be a complex exercise. Luckily we can use a simple heuristic for calculating the power output in India:
| 1 KWp of panel will generate about 1,400-1,600 KWh (units) per year i.e., about 4 KWh per day. This is broadly representative of output from rooftop PV plants in India. It is an average calculated over a year. Generation on individual days at your location will vary based on meteorological conditions. |
PV power plant performance is often denominated as Capacity Utilisation Factor or CUF. CUF is the ratio (expressed as a percentage) of the actual output from a plant to the maximum possible output under ideal conditions if the sun shone throughout the day and throughout the year.
| Capacity Utilisation Factor (CUF) = | Actual energy from the plant (KWh) | |||||
| Plant capacity (KWp) x 24 x 365 | ||||||
| State |
CUF (%) |
Output for 1 KWp panel (KWh/day) |
| Andhra Pradesh | 20 | 4.80 |
| Gujarat | 18 | 4.32 |
| Karnataka | 19 | 4.56 |
| Madhya Pradesh | 19 | 4.56 |
| Maharashtra | 19 | 4.56 |
| Punjab | 19 | 4.56 |
| Rajasthan | 20 | 4.80 |
| Tamil Nadu | 19 | 4.56 |
| Uttarakhand | 19 | 4.56 |
Note: The above calculation is an estimation based on average plant performance across the Indian states. Output at your location may vary from these estimates.
PV plant outputs in different states in India for different roof areas
Based on the above, we can estimate the approximate power output for PV plants on different roof sizes in different parts of India:
| Roof area (SF) | 500 | 1,000 | 1,500 | 2,500 | 5,000 | 10,000 |
| Plant capacity (KW) 1 KW = 100 SF |
5 | 10 | 15 | 25 | 50 | 100 |
| State | Output (KWh/day) | |||||
| Andhra Pradesh | 24.00 | 48.00 | 72.00 | 120.00 | 240.00 | 480.00 |
| Gujarat | 21.60 | 43.20 | 64.80 | 108.00 | 216.00 | 432.00 |
| Karnataka | 22.80 | 45.60 | 68.40 | 114.00 | 228.00 | 456.00 |
| Madhya Pradesh | 22.80 | 45.60 | 68.40 | 114.00 | 228.00 | 456.00 |
| Maharashtra | 22.80 | 45.60 | 68.40 | 114.00 | 228.00 | 456.00 |
| Punjab | 22.80 | 45.60 | 68.40 | 114.00 | 228.00 | 456.00 |
| Rajasthan | 24.00 | 48.00 | 72.00 | 120.00 | 240.00 | 480.00 |
| Tamil Nadu | 22.80 | 45.60 | 68.40 | 114.00 | 228.00 | 456.00 |
| Uttarakhand | 22.80 | 45.60 | 68.40 | 114.00 | 228.00 | 456.00 |
Optimising rooftop PV plant design to maximise power output
Amongst these 4 factors, location is not usually within our control when setting up a captive rooftop solar plant. Some optimisation is possible with the other three factors.
Orientation
We can, to some extent, overcome roof orientation issues using trackers. This will, however, add both to the initial cost and maintenance expenditure of the installation. The cost-benefit of using trackers will have to be carefully analysed for the particular installation to determine if it is worth the additional investment.
Panel Efficiency
If rooftop space is a constraint we can use panels of greater efficiency to maximise the output from the space available.
Ambient Temperature
Ambient temperature is not within our control, but we can help cool the panels by ensuring that we provide adequate room for air to circulate around and under the PV panels. We have seen plant performance improve significantly when panels that were mounted too close to the roof were raised to allow greater air circulation.
Takeaways
- Rooftop PV plant output is dependent on
- Location
- Roof orientation
- Panel efficiency
- Ambient temperature
- Two panels of identical rated capacity but different efficiency will produce the same amount of power, but occupy different amounts of space
- Heat affects the panel efficiency, and peak summer months can give lower output than some winter months
- We can mitigate some of the effects of temperature by designing the plant to maximise air cooling
- In India Rooftop Solar PV produces about 4 KWh/day for every 1 KWp of panel capacity
Related Posts:
- Solar Project Engineer Position in Manufacturing Company – Pondicherry
- Online Training Course on Solar Design and Installation
- Chennai Industry Utilizes Solar Parabolic Troughs to Meet Heating Requirements
- TajSATS Chennai Implements Elevated Solar Rooftop Plant
- Ecoprogetti Shines Bright in India through its Premium PV Module Line Offerings