
Themes in this post: China | United States | Japan | Germany | Australia | Other emerging regions | India & rest of the world
Hitesh Doshi, the Chairman of Waaree Group and the most recent addition to India’s burgeoning billionaire list, said in an interview that his earliest realisation about the potential of solar energy was during a visit to a trade exhibition in Germany in 2007, which inspired him to sell his then business and focus on solar-cell manufacturing. In 2007, Germany already had total solar power installations of over 4 GW, far, far higher than what countries such as India or China had.
Well before countries such as India, China and the US got on to the solar power bandwagon, countries such as Germany and Japan were in the game. Japan and Germany had significant solar power installations before China, USA & India started their ascent and overtook them.
Germany and Japan are still a force to reckon with. Besides these early adopter countries, new countries around the world – all the way from Australia to some in South America – are also becoming important growth centers for solar power worldwide.
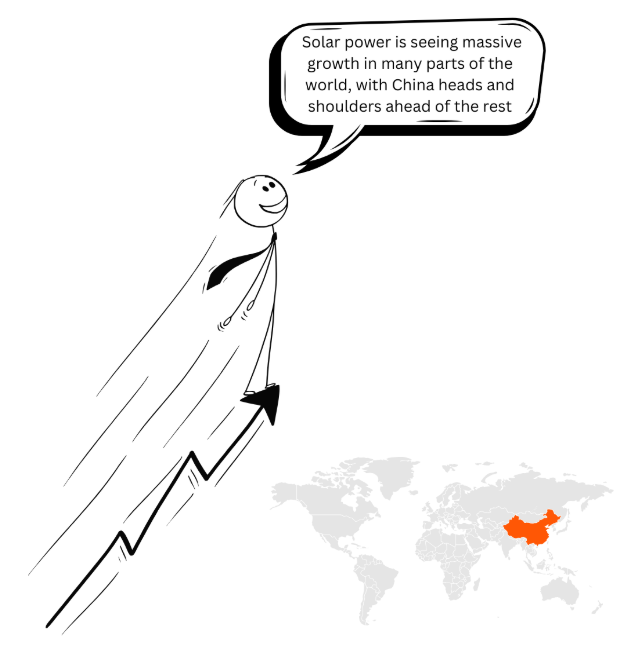
Without a doubt however, leading the global solar charge is China. The country is far, far ahead of anyone else.
Next up, the United States is growing steadily. While the growth of solar in the US could sound moderate compared to that for China, in absolute terms, the US solar installations over the last few years have been quite impressive.
India comes in third in the overall global pecking order. For the 2020-2025 period, India on average installed about a half of what the US installed every year, and despite what can be considered a fairly good performance, just a tenth of what China installed! Such is the magnitude of the Chinese solar power sector scaling up.
Meanwhile, Japan and Germany, earlier global leaders in solar power, are trying to get their momentum back. Thousands of miles of away, the giant continent of Australia, with its vast amounts of land and sunshine, is also becoming a major player in the installation and use of solar power plants.
But the solar party list doesn’t stop there – emerging regions in Africa, the Middle East, and Latin America are also tuning up. Countries like Morocco, Saudi Arabia, and Chile are leveraging their abundant sunlight and strategic initiatives to shine brightly on the global stage.
China – the 800 pound G
China had a humungous 890 GW installed capacity by end of 2024.
China is the 800-pound gorilla of the solar power sector, without a shred of doubt. But it was not like that 15 years back. China’s growth in solar power started massively around 2010.
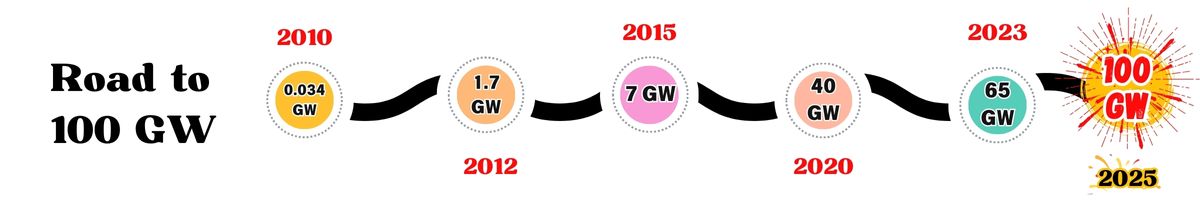
By end of 2010, China had about 1 GW (about 700 MW) of installed solar capacity, which was a small proportion of the global capacity of about 40 GW. By 2020, China’s capacity exceeded 250 GW, reflecting an astonishing #H250-fold increase in just ten years#H! in 2023 alone, the country added a record 217 GW of new capacity, pushing the total installed solar capacity well past 500 GW. In the same year, the entire rest of world together added about 230 GW – almost the same as what China alone did!
How did such a massive scaling of solar happen in China? It was through a mix of strong government policies, aggressive renewable energy target setting, economies of large scale production resulting in decreased costs and strategic industrial policies through which China became the de facto manufacturing hub for solar.
That’s the China solar story for you in brief, a story similar to what you would have heard in quite a few other industries as well!
United States
The USA, second in the ranking, had about 220 GW installed capacity by end of 2024
In 2010, the US had around 2.5 GW of installed solar capacity. By 2020, it had reached 97 GW, supported by residential and commercial sectors, and by the end of 2024, it had reached an impressive 220 GW.
Policies like the Investment Tax Credit (ITC) provided financial incentives for solar investments. Renewable portfolio standards and net metering policies at the state level encouraged adoption.
In 2022, solar power contributed around 5% of total electricity generation, up from just 0.1% in 2010. While there are some doubts about the speed at which the country’s solar power sector will grow as a result of the Trump administration’s cold shoulder to renewables, there is also optimism that the solar power sector has reached such a momentum that it can grow quite well even without government support.
Germany
Germany had about 100 GW installed capacity by end of 2024
Germany has been a pioneer in promoting solar energy since the early 2000s, leading to widespread adoption and capacity growth. By 2015, Germany had about 40 GW of installed solar capacity, by the end of 2023, the capacity reached about 82 GW, and it almost touched 100 GW by end of 2024.
The Renewable Energy Sources Act (EEG) introduced feed-in tariffs and guaranteed grid access for renewable energy producers. This provided long-term contracts and stable returns for solar power investors. All these are part of #HEnergiewende#H, the German term for the country’s energy transition, which is a long-term plan to move Germany towards a climate-neutral energy system.
Local renewable energy projects allowed communities to benefit directly from solar power generation.
Comparing Japan & Germany, both countries had similar installed capacities of solar power in 2023, but as Japan is a more “sunlit” country than Germany, the former generated significantly more solar power during that year, and was third in ranking for solar power generation until India surpassed it that year as mentioned above.
The growth of solar in both countries were driven by policies such as feed-in tariffs that provided financial incentives and reduced risks for investors and consumers. High levels of public support and involvement in renewable energy projects contributed to widespread adoption. Japan emphasized rooftop and urban installations due to limited land availability, while Germany leveraged both large-scale solar farms and distributed generation to maximize solar potential.
India
India had a total cumulative solar PV installed capacity of about 98 GW, just a shade lower than of Germany, by end of 2024.
While India was technically 4th in installed capacity by 2024, we can expect that India will be much ahead of Germany by end of 2025, given than India plans to install 35 GW or more in 2025 while Germany is expected to install about 20 GW.
You can hence consider India to be currently (February 2025) ranked 3rd currently on solar PV installed capacity.
Japan
Japan had about 90 GW of installed capacity by end of 2024
By end of 2024, Japan had approximately 90 GW of installed solar capacity, and is one of the top five countries in solar power installations. Japan has had favourable policies towards solar power for quite some time, and #Hpost the Fukushima nuclear disaster#H in 2011, the country placed even greater emphasis on renewable energy sources.
Due to limited land availability, Japan focused on maximizing the use of available space through rooftop and urban solar installations. Local communities and cooperatives actively participate in solar projects, fostering a culture of renewable energy adoption.
In 2023, India overtook Japan as the world’s third largest producer (generation, not capacity) of solar power.
Australia
Given the large tracts of land and the generous amount of sunshine it receives, it should be no surprise that Australia is one of the leading countries in solar power generation. As of early 2025, it has a cumulative installed solar power capacity of about 40 GW.
This might be much less than India’s (100 GW) or China’s (close to 700 GW), but if you use a different metric, Australia’s solar story is quite exceptional – and that metric is solar capacity per capita. While India has 100 GW for a population of 1400 million, China has 700 GW for about the same population, Australia has 40 GW for a population of just 27 million – in solar capacity per capita, #HAustralia’s is about 30 times#H that of India and 8 times of China!
Interestingly, a dominant portion of Australia’s solar power capacity is driven by rooftop solar – almost 65%. In the case of most other prominent solar power countries including India, ground-mounted solar power plants contribute to the lion’s share of the total installed capacity.
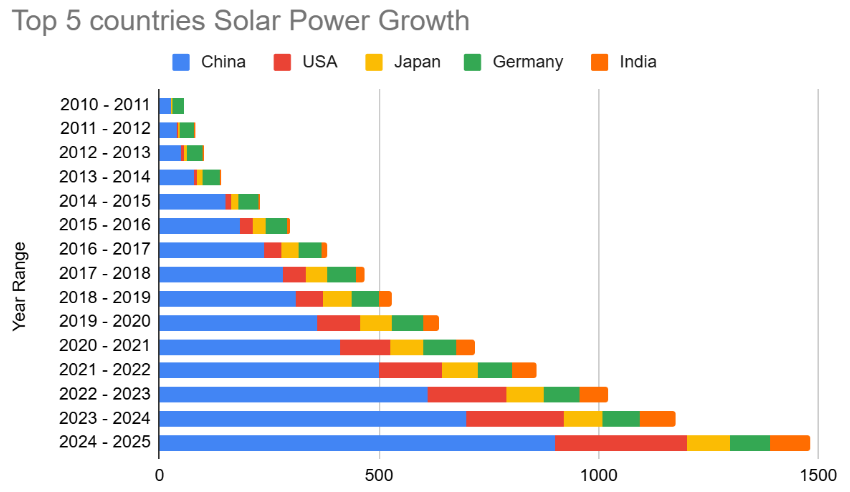
Figure: Solar Power growth for the top 5 countries (in GW)
Other emerging regions
Be they oil rich countries in Middle East or less-rich countries in Asia and Africa, most regions worldwide are fast investing in large-scale solar power capacities
Several regions around the world are poised to become emerging markets for solar power due to their natural resources, policy support, and growing energy needs. These include regions in Asia (beyond China and India), countries such as Vietnam, Thailand, and the Philippines.
In Africa, countries such as Morocco. Egypt, Kenya, and Nigeria are keen on large investments into solar power.
The Middle East is also seeing significant solar power action with countries such as Saudi Arabia (with its Vision 2030 initiative, Saudi Arabia plans to generate 50% of its energy from renewable sources by 2030), UAE (which hosts the Mohammed bin Rashid Al Maktoum Solar Park), Jordan (Shams Ma’an Solar Power Plant), Oman (Ibri II Solar Power Plant) and Qatar are prominent players. For the Middle East, it is as much an environmental strategy as it is economic, as they are investing in solar to diversify energy sources.
Latin American countries such as Chile, Brazil, and Mexico are also implementing policies to encourage aggressive growth of solar power.
India & the world
How does India compare competitively compared to the rest of the world’s prominent solar regions?
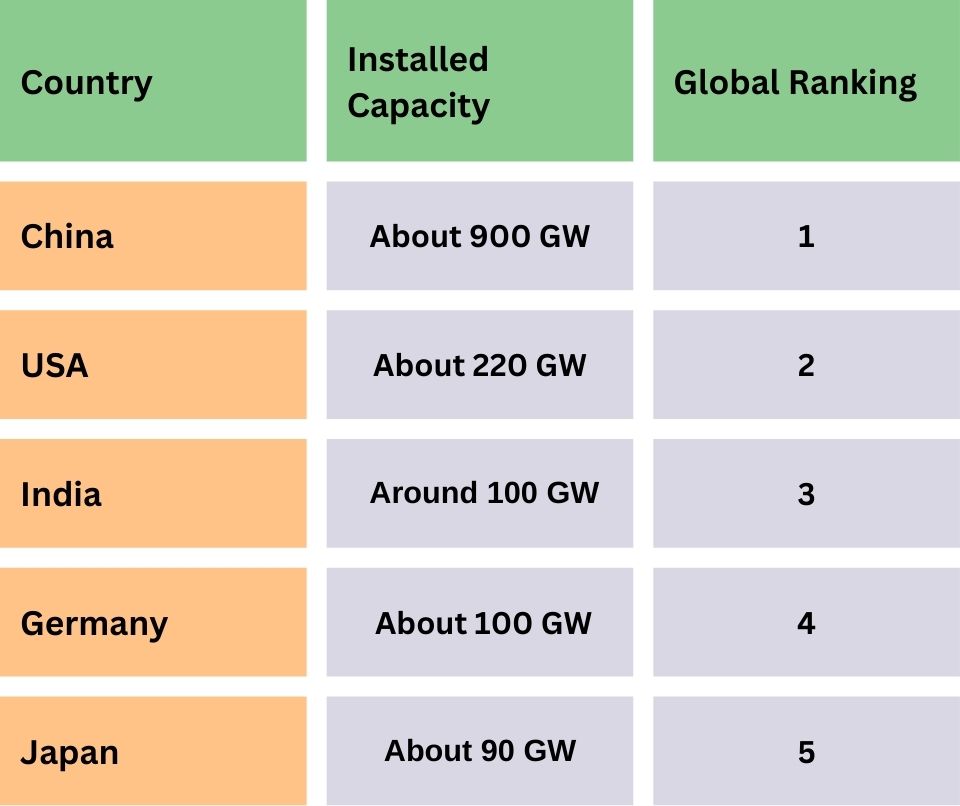
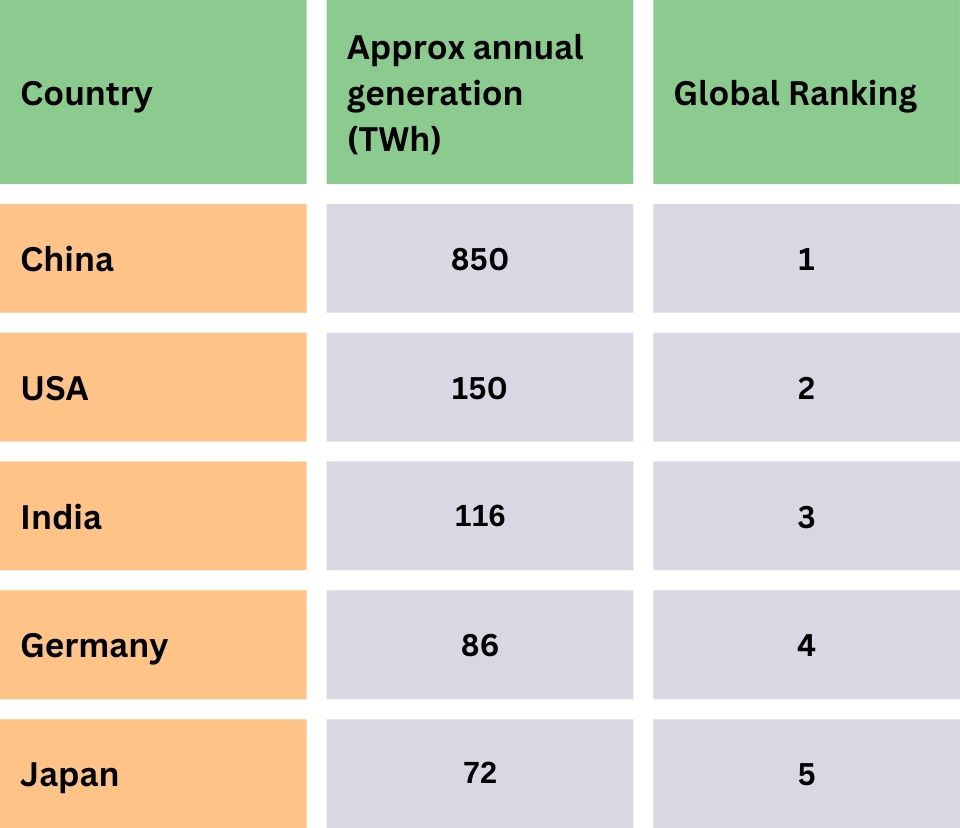
As of 2025, India stands #Hthird in the world#H in installed solar power capacity and generation, and #Hfourth#H in solar’s contribution to overall electricity consumption
Installed Solar Capacity and Global Rankings (as of Jan 2025)
Solar Power Generation Global Rankings (for 2024)
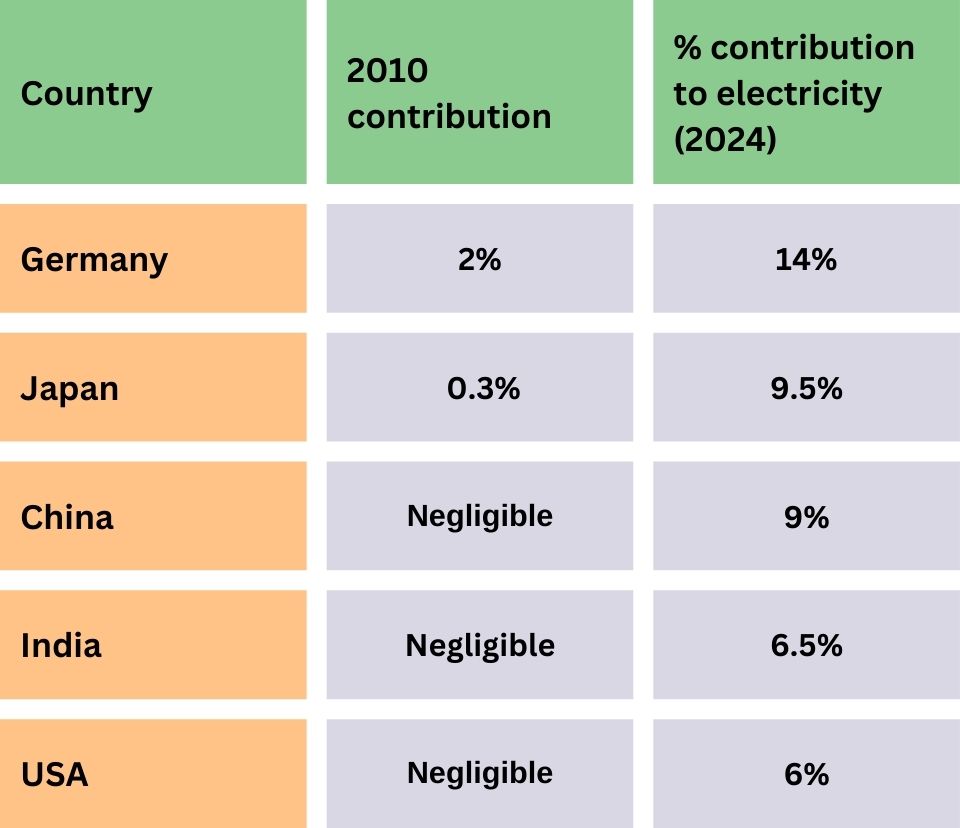
Solar Contribution to Electricity Generation*
*: Solar Mango estimates